The first time I used db2top’s Dynamic SQL screen, I tried the ‘X’ key to switch to extended mode and had no idea what I had just done. Everything was reordered, hash values seemed to completely change, and the values in the Num Execution column shot upward. Eventually, I realized what was happening and I will share that with you in today’s post along with other details about the Dynamic SQL screen.
The Dynamic SQL screen is a basic screen with just a table of dynamic statements. It does not show any gauges or other aggregates. It does, however, let you view the full text of individual SQL statements and perform explains on them.
The Dynamic SQL screen is invoked by holding down the Shift key and pressing the ‘D’ key.
The table of dynamic SQL statements consists of the following columns:
| Column Name | Definition |
|---|---|
| SQL_Statement HashValue | A hash computed from the text of the SQL statement (stmt_text). Printed in green text if the statement consumed CPU in the last three intervals. |
| Sql Statement (30 first char.) | The text of the SQL statement, truncated to 30 characters (stmt_text). Printed in bold, yellow text if the statement consumed CPU in the last three intervals. |
| Num Execution | The number of times that the SQL statement has been executed (num_executions). |
| Exec Time | The total time that was spent executing the statement (total_exec_time). |
| Column Name | Definition |
|---|---|
| Avg ExecTime | The average time across all executions of the statement in the SQL cache (total_exec_time / num_executions). |
| Cpu Time | The total CPU time for the statement (total_sys_cpu_time + total_usr_cpu_time). |
| Avg CpuTime | The average CPU time across all executions of the statement in the SQL cache ((total_sys_cpu_time + total_usr_cpu_time) / num_executions). |
| Rows read | The number of rows read by the statement (rows_read). |
| Rows written | The number of rows changed (inserted, deleted or updated) by the statement (rows_written). |
| Data l_reads | The number of data pages that have been requested by the statement from the buffer pool (logical) for regular and large table spaces (pool_data_l_reads). |
| Data Hit% | The percentage of those data pages requested by the statement from the buffer pool for regular and large table spaces that have been read in from the table space containers (pool_data_p_reads / pool_data_l_reads). |
| Column Name | Definition |
|---|---|
| Index l_reads | The number of index pages that have been requested by the statement from the buffer pool (logical) for regular and large table spaces (pool_index_l_reads). |
| Index Hit% | The percentage of those index pages requested by the statement from the buffer pool for regular and large table spaces that have been read in from the table space containers (pool_index_p_reads / pool_index_l_reads * 100%). |
| Temp l_reads | The number of pages (index and data) that have been requested by the statement from the buffer pool (logical) for temporary table spaces (pool_temp_data_l_reads + pool_temp_index_l_reads). |
| Temp Hit% | The percentage of those pages (index and data) requested by the statement from the buffer pool for temporary table spaces that have been read in from the table space containers.
(pool_temp_data_p_reads + pool_temp_index_p_reads) / (pool_temp_data_l_reads + pool_temp_index_l_reads) * 100% |
| AvgSort PerExec | The average number of times per execution of the statement that a set of data was sorted in order to process the statement (stmt_sorts / num_executions). |
| Sort Time | The total elapsed time for all sorts that have been executed by this statement (total_sort_time). This value is reported in milliseconds. |
| Recent Cpu | The CPU time consumed by the statement during the previous three intervals (total_sys_cpu_time + total_usr_cpu_time). |
The Query Text Dialog Box
The footer of the Dynamic SQL screen indicates that holding the Shift key and pressing the ‘L’ key will let you look at query text. When you do so, a prompt appears at the top of the screen directly under the header requesting the hash string for query whose text you wish to see.

At this point, the easiest thing to do is to use your mouse to select the SQL_Statement HashValue for the row containing the query you wish to see and paste that at the prompt, as shown in the video below.
From the Query text dialog box that pops up, you can do the following:
- Press ‘e’ to run db2expln on the statement.
- Press ‘x’ to run db2exfmt on the statement.
- Press ‘w’ to write a file containing the query text to the current working directory. The file’s name is a combination of the word “dynsql” with the hash value of the statement and the extension “.sql”.
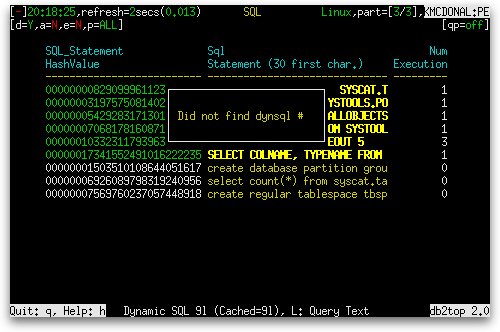
- Hold down the Shift key and press ‘E’ to launch the editor pointed to in your $EDITOR environment variable to edit the statement text. If, when presented with the hash value prompt, you type a hash value that does not exist, you get an error message like the following:

Extended Mode
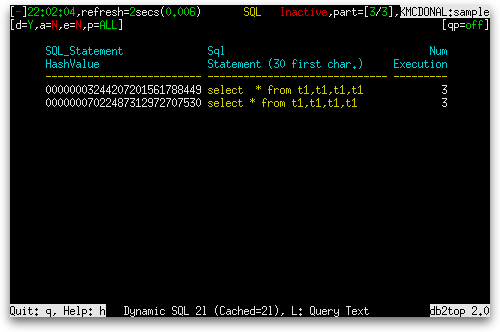
DB2 itself can identify when the same statement is executed multiple times, but only with very precise criteria. An extra space here or there means DB2 sees two different statements when there is really only one. There is some special logic in db2top to rectify this problem and that logic is invoked when running in extended mode. The modified SQL text that improves the matching of identical statements results in different hash values, and because the default ordering for the Dynamic SQL screen is to order by hash value, switching extended mode on often reorders the statements. Here is an example: In the first image below, extended mode is off and we see two statements that only differ by their whitespace are treated as two separate statements, each with their own statistics:

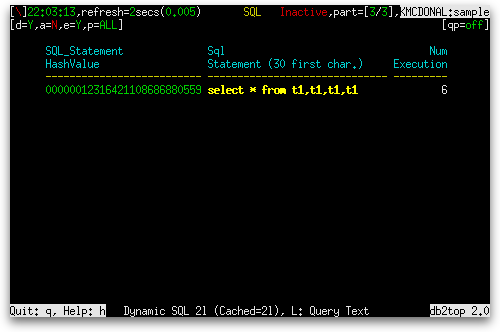
When we turn on extended mode by holding the Shift key and pressing the ‘X’ key, the two statements collapse into one, the statistics are aggregated together, and a new hash value is computed that is different from both of the above two statements’ hash values:


