To understand on a deep level how DB2 for LUW executes your SQL, you need to understand the concepts of agents, subagents, sections, and subsections. DB2, especially with the Data Partitioning Feature (DPF), takes advantage of parallelism, not only in running large numbers of SQL statements simultaneously, but also to execute efficiently the individual statements themselves. When a statement comes into DB2, it can be broken down into multiple subsections and a subagent can process each subsection in parallel with one another to quickly return a result. The db2top Agent screen gives you insight into this process, allowing you to see the state of each subagent and subsection as a statement is executed and helping you identify the source of performance problems such as the occurrence of a sort or hash join overflow. In today’s post, we will examine the Agent screen for non-DPF systems.
The db2top Agent screen is a bit of an oddball. You need to know the agent ID before you attempt to use it, so although you can launch it from anywhere within db2top, you’ll probably want to launch it from a screen where you can see a list of agent IDs, such as the Sessions screen.
Alternatively, if you have a command prompt handy, you can run "db2 list applications" and the get the agent ID (also known as the Appl. Handle) from the third column.
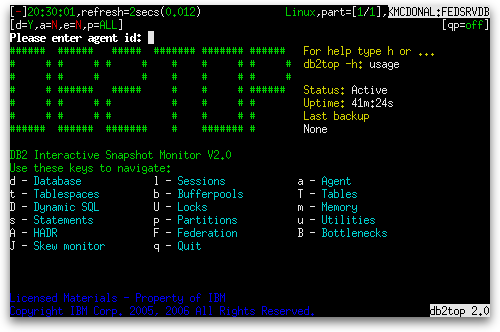
Pressing the ‘a’ key causes a prompt to appear directly under the header on the left side of the screen, as shown below:

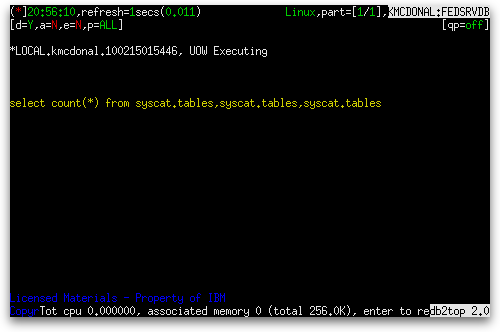
After you enter the agent ID and press Enter, you are shown a very basic screen with the application ID and state, and, if the application is executing some SQL at the time, you also see the SQL text:

The footer shows the total CPU and associated and total memory.
When you specify an invalid agent ID at the agent ID prompt, the message "No data available, rc -2" is shown at the top left of an otherwise blank screen.
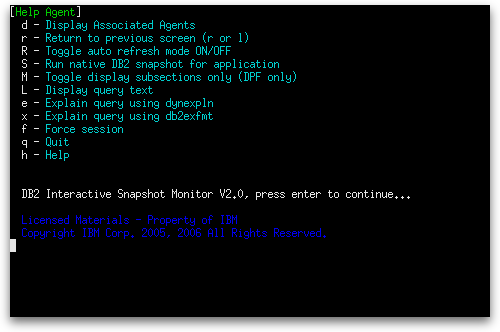
The ‘k’, ‘i’, ‘X’, and ‘G’ keys have no effect. In fact, the Agent screen has its own set of keys for taking several actions and even has its own help screen, accessed by pressing the ‘h’ key:

The ‘S’ key to take a native snapshot behaves the same way as it does for the other screens and will be covered in a separate topic. The ‘L’ key behaves similarly to that of the Dynamic SQL screen, popping up a window containing the SQL text and listing four additional actions you can take. The difference is that you are not prompted to specify a hash value here.
The ‘e’ and ‘x’ keys available on the main agent screen are simply shortcuts to avoid having to press the ‘L’ key first. The ‘r’ key lets you return to the screen from which you launched the agent screen and the ‘l’ (lowercase L) key does the same thing.
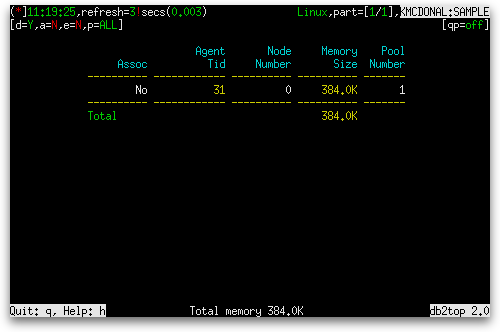
Pressing the ‘d’ key displays a table as shown below:

The table contains the following columns:
| Column Name | Definition |
|---|---|
| Assoc | “Yes” if this agent is associated with an application, otherwise “No”. |
| Agent Tid | The unique identifier for the engine dispatchable unit (EDU) for the agent (agent_pid). Except on the Linux® operating system, the EDU ID is mapped to the thread ID. On the Linux operating system, the EDU ID is a DB2® generated unique identifier. |
| Node Number | The number assigned to the node on which the agent is running (node_number). |
| Memory Size | The current size of the agent’s memory pool (pool_cur_size). |
| Pool Number |
A number that represents the agent’s memory pool’s type (pool_id). Can be one of the following:
|
Associated agents and non-associated agents are listed separately. At the bottom of each list is a row that shows the total memory size for the agents in the list.
The ‘f’ key is for forcing the application off the database. You are asked to confirm that you really wish to force the application before it goes ahead with the force.
In the next post, we will see a greatly expanded Agent screen when we use db2top on a DPF instance of DB2.

