
In the first post on the Sessions screen, we examined the gauges and table columns that appear when the screen is 80 to 140 columns wide. In the second post, we saw what additional columns appear when you increase the width of the screen past 140 columns. In this final post on the Sessions screen, we will see the additional information that appears for large screens when extended mode is enabled.
You toggle extended mode on and off by holding the Shift key and pressing the ‘X’ key. When you enable extended mode for a screen that is at least 141 columns wide, the Sessions screen appears as shown below:
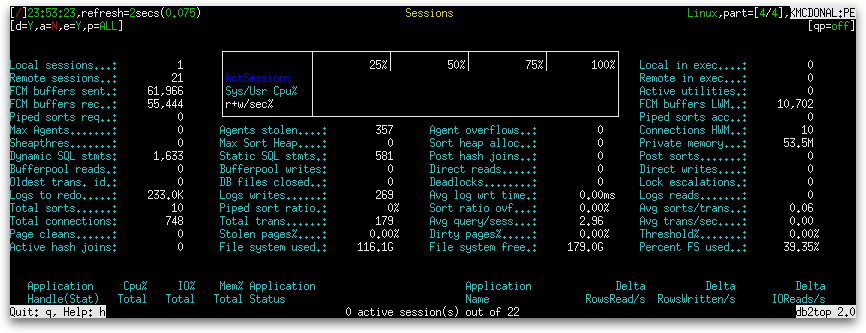
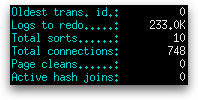
To the column on the left side of the gauges, extended mode adds:
| Name | Definition |
|---|---|
| Oldest trans. id | The application ID (which corresponds to the agent_id value from the application snapshot) of the application that has the oldest transaction (appl_id_oldest_xact). |
| Logs to redo | The amount of log, expressed in units of some multiple of bytes (e.g. KB, MB, etc.), that will have to be redone for crash recovery (log_to_redo_for_recovery). |
| Total sorts | The total number of sorts that have been executed (total_sorts). |
| Total connections | The number of connections to the database (coordinator agents) since the first connect, activate, or last reset (total_cons). |
| Page cleans |
The number of times a page cleaner was invoked. A page cleaner may be invoked for any one of the following reasons:
pool_lsn_gap_clns + pool_drty_pg_steal_clns + pool_drty_pg_thrsh_clns |
| Active hash joins | The total number of hash joins that are currently running and consuming memory (active_hash_joins). |
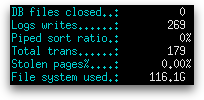
To the first column under the gauges, extended mode adds:
| Name | Definition |
|---|---|
| DB files closed | The total number of database files closed (files_closed). |
| Logs writes | The number of log pages written to disk by the logger (log_writes). |
| Piped sort ratio | The percentage of requested pipe sorts that were accepted (piped_sorts_accepted / piped_sorts_requested × 100%). |
| Total trans | The total number of SQL COMMIT and SQL ROLLBACK statements that have been attempted (commit_sql_stmts + rollback_sql_stmts). |
| Stolen pages% |
The percentage of page cleaner invocations that were due to the logging space used having reached a predefined criterion for the database. pool_lsn_gap_clns × 100% / (pool_lsn_gap_clns + pool_drty_pg_steal_clns + pool_drty_pg_thrsh_clns) |
| File system used | The amount of space already used on a file system, measured across all storage paths or containers.
sum(fs_used_size) where sum() means summing across all storage paths or containers. |
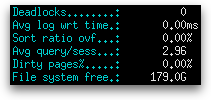
To the second column under the gauges, extended mode adds:
| Name | Definition |
|---|---|
| Deadlocks | The total number of deadlocks that have occurred (deadlocks). |
| Avg log wrt time | The average elapsed time in milliseconds per log page spent by the logger writing log data to disk (log_write_time × 1000 / log_writes). |
| Sort ratio ovf | The percentage of sorts that ran out of sort heap and may have required disk space for temporary storage (sort_overflows * 100% / total_sorts) |
| Avg query/sess | The number of SQL statements attempted per connection to the database since the first connect, activate, or last reset. |
| Dirty pages% | The percentage of page cleaner invocations that were due to a synchronous write being needed during the victim buffer replacement for the database
pool_drty_pg_steal_clns * 100% / (pool_lsn_gap_clns + pool_drty_pg_steal_clns + pool_drty_pg_thrsh_clns) |
| File system free | The amount of free space available on a file system, measured across all storage paths or containers. If multiple storage paths point to the same file system, its free storage will be counted multiple times.
sum(sto_path_free_sz) where sum() means summing across all storage paths or containers. |
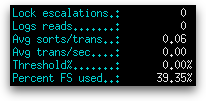
To the column on the right side of the gauges, extended mode adds:
| Name | Definition |
|---|---|
| Lock escalations | The number of times that locks have been escalated from several row locks to a table lock (lock_escals). |
| Logs reads | The number of log pages read from disk by the logger (log_reads). Shown in reverse text when log_reads has increased since the last snapshot. |
| Avg sorts/trans | The average number of sorts executed per transaction. |
| Avg trans/sec | The average number of transactions completed per second since the last snapshot reset or database activation.
(commit_sql_stmts + rollback_sql_stmts) / number of seconds since last snapshot reset or database activation |
| Threshold% | The percentage of page cleaner invocations that were due to a buffer pool having reached the dirty page threshold criterion for the database. pool_drty_pg_thrsh_clns * 100% / (pool_lsn_gap_clns + pool_drty_pg_steal_clns + pool_drty_pg_thrsh_clns) |
| Percent FS used | The percentage of used space on the file system, measured across all storage paths or containers. If multiple storage paths point to the same file system, its free storage will be counted multiple times, giving an inaccurate number for this percentage.
1 – sum(sto_path_free_sz) / sum(sto_path_free_sz + fs_used_size) where sum() means summed across all storage paths or containers. Shown in reverse text when 90% or higher. |
The footer at the bottom of the page lists the number of active sessions and the total number of sessions.

Pingback: Don’t Forget About The Site Search Feature! « The K Guy()