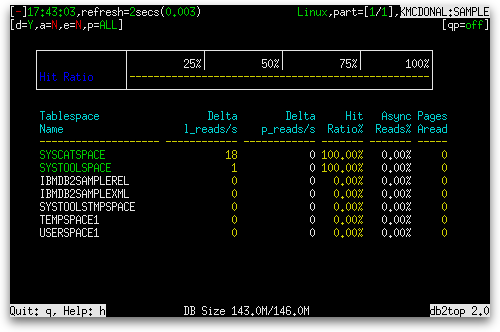
 Databases are generally concerned with storing data on disk and retrieving it quickly, which makes monitoring the speed of your reads and writes essential. It is also important to know how fast your storage needs are growing, the makeup of your workload (writes versus reads), and whether data is being efficiently cached in memory. All of this information is available to you on the Tablespaces screen of db2top. In today’s post, we’ll take a look at some of the aggregates that db2top computes for you across all of your tablespaces. You’ll see how it’s possible to have a hit ratio of 90% while at the same time having an average hit ratio of only about 50%.
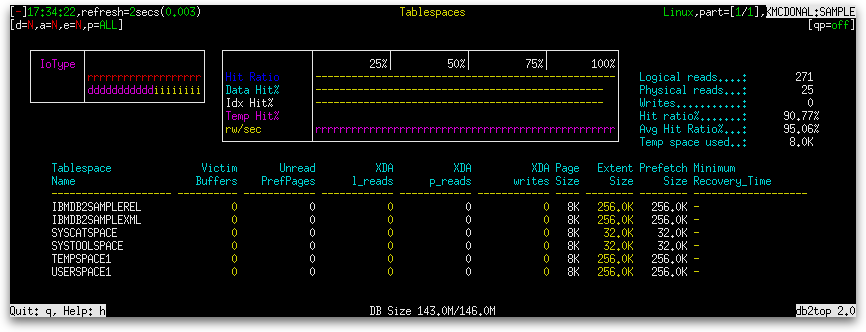
The Tablespaces screen is a typical db2top screen, with a block of gauges at the top and a table of table spaces and their attributes beneath it. When the screen is between 80 and 140 columns wide, the block of gauges contains a single gauge for Hit Ratio.

| Gauge Name | Gauge Type | Definition |
|---|---|---|
| Hit Ratio | Normal | The percentage of requests for pages (data or index) from buffer pools, measured across all table spaces, that were serviced without requiring a physical read from a table space container.
(1 – sum(pool_data_p_reads + pool_index_p_reads + pool_temp_data_p_reads + pool_temp_index_p_reads) / sum(pool_data_l_reads + pool_index_l_reads + pool_temp_data_l_reads + pool_temp_index_l_reads)) × 100%, where sum() means measuring across all table spaces |
However, once you increase the width to 141 or more columns, the screen changes to something like the following:

Several more gauges appear:
| Gauge Name | Gauge Type | Definition |
|---|---|---|
| Data Hit% | Normal | The percentage of requests for data pages from buffer pools, measured across all regular and large table spaces, that were serviced without the need for a physical read from a table space container.
(1 – sum(pool_data_p_reads) / sum(pool_data_l_reads)) × 100%, where sum() means measuring across all regular and large table spaces |
| Idx Hit% | Normal | The percentage of requests for index pages from buffer pools, measured across all regular and large table spaces, that were serviced without the need for a physical read from a table space container.
(1 – sum(pool_index_p_reads) / sum(pool_index_l_reads)) × 100%, where sum() means measuring across all regular and large table spaces |
| Temp Hit% | Normal | The percentage of requests for data pages from buffer pools, measured across all temporary table spaces, that were serviced without the need for a physical read from a table space container.
(1 – sum(pool_temp_data_p_reads + pool_temp_index_p_reads) / sum(pool_temp_data_l_reads + pool_temp_index_l_reads)) × 100%, where sum() means measuring across all temporary table spaces |
| rw/sec | Average Seconds |
where:
|
A second block of gauges appears to the left of the main block of gauges and a list of aggregates appears to the right. The only gauge on the left is labeled IoType.
| Gauge Name | Gauge Type | Definition |
|---|---|---|
| IoType | IO Breakdown |
The first line of the gauge presents two pieces of data:
The second line presents three pieces of data:
The length of each sequence of the same character is proportional to how much of the total I/O that the particular I/O subtype (reads, writes, data, index, or temp) contributes. |
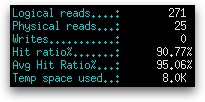
The aggregates on the right consist of the following:
| Name | Definition |
|---|---|
| Logical reads |
|
| Physical reads |
|
| Writes |
|
| Hit ratio% | The percentage of requests for pages (data or index) from buffer pools, measured across all table spaces, that were serviced during the last interval without requiring a physical read from a table space container.
(1 – sum(pool_data_p_reads + pool_index_p_reads + pool_temp_data_p_reads + pool_temp_index_p_reads) / sum(pool_data_l_reads + pool_index_l_reads + pool_temp_data_l_reads + pool_temp_index_l_reads)) × 100%, where sum() means measuring across all table spaces |
| Avg Hit Ratio% | Similar to Hit ratio% above but weighting all table space hit ratios equally. For example, if table space TS1 had 1 hit in 10 requests and table space TS2 had 89 hits in 90 requests, the Hit ratio% would be (1 + 89) / (10 + 90) = 90% and the Avg Hit Ratio% would be (1/10 + 89/90) / 2 = 54%. |
| Abnormal | The number of table spaces whose state (tablespace_state) is not NORMAL (SQLB_NORMAL in sqlutil.h). This row is not shown when all table spaces are in the NORMAL state. The text is shown in red. |
| Temp space used | The total amount of space, expressed as a multiple of bytes (e.g. KB, MB, etc.), that is currently in use by user or system temporary table spaces (sum(tablespace_used_pages × tablespace_page_size), where sum() means summing across all user and system temporary table spaces). |
In part 2, we will examine the individual table spaces themselves as they appear in the table below the gauge section.


