A well-tuned DB2 for LUW system strikes a careful balance among the various consumers of resources such as CPU, disk, and memory. Applications, utilities, and internal database processes all compete for limited memory resources. The db2top tool can give you insight into your biggest memory consumers using the Memory screen, which we will examine in today’s post.
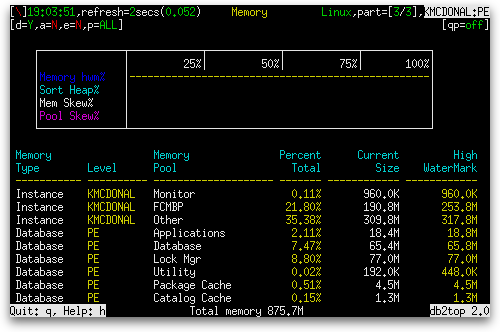
You launch the Memory screen by pressing the ‘m’ key. When the screen is between 80 and 140 columns wide, it takes the form of the usual combination of a set of gauges and a table, as shown below:

The gauges are as follows:
| Gauge Name | Gauge Type | Definition |
|---|---|---|
| Memory hwm% | Normal |
The sum of the memory usage high watermarks across all types of memory pool during the interval as a percentage of the highest such sum since the time this screen was first launched.
sum(pool_watermark) / max(sum(pool_watermark)), where sum() means summing across all memory pools across all partitions and max() means finding the maximum since the memory pool screen was first launched. |
| Sort Heap% | Normal | The percentage of the sort heap threshold that is allocated for all sorts at the database level at the time the snapshot was taken (sort_heap_allocated/sheapthres). |
| Mem Skew% | Normal | A measure of asymmetry in the distribution of total memory pool consumption among partitions.
1 – ((nodesum(poolsum(pool_cur_size))/nodecount) / max(poolsum(pool_cur_size)), where nodesum() means summing across all partitions, poolsum() means summing across all memory pools, nodecount means the number of partitions of the database, and max() means the maximum out of all partitions |
| Pool Skew% | Normal | A measure of asymmetry in the distribution of memory pools among partitions.
1 – ((sum(poolcount)/nodecount) / max(poolcount), where sum() means the sum across all partitions, max() means the maximum out of all partitions, nodecount means the number of partitions of database, and poolcount means the number of pools on a partition |
The table columns are as follows:
| Column Name | Definition |
|---|---|
| Memory Type |
Displays one of three possible values:
|
| Level | If the memory type is “Instance”, the name of the instance is shown. Otherwise, the name of the database is shown. |
| Memory Pool |
The type of memory pool (pool_id). It can have one of the following values:
|
| Percent Total | The percentage of the total memory consumed across all memory pools that is consumed by memory pools of this type (sum(pool_cur_size) / sum_all(pool_cur_size) × 100%, where sum() means summing across all memory pools of this type and sum_all() means summing across all memory pools). |
| Current Size | The current amount of memory in use by memory pools of this type (sum(pool_cur_size) where sum() means summing across all memory pools of this type, even across partitions). Shown in bold yellow text when it has shrunk since the last measurement. Shown in bold green text when it has grown since the last measurement. |
| High Watermark | The sum of the high watermarks of memory usage since creation for all memory pools of this type (sum(pool_watermark), where sum() means summing across all memory pools of the same type, even across partitions). Expressed in units that are a multiple of bytes (e.g. KB, MB, etc.). Shown in bold green text when the sum of the high watermarks has increased since the previous measurement. |
| Percent Max | The percentage of configured memory for all memory pools of this type that is in use (sum(pool_cur_size) / sum(pool_max_size) × 100%, where sum() means summing across memory pools of the same type, even across partitions). |
| Maximum Size | The internally configured memory for all memory pools of this type (sum(pool_max_size), where sum() means summing across all memory pools of the same type, even across partitions). Expressed in units that are a multiple of bytes (e.g. KB, MB, etc.). |
| # of Pool(s) | The number of memory pools of this type. |
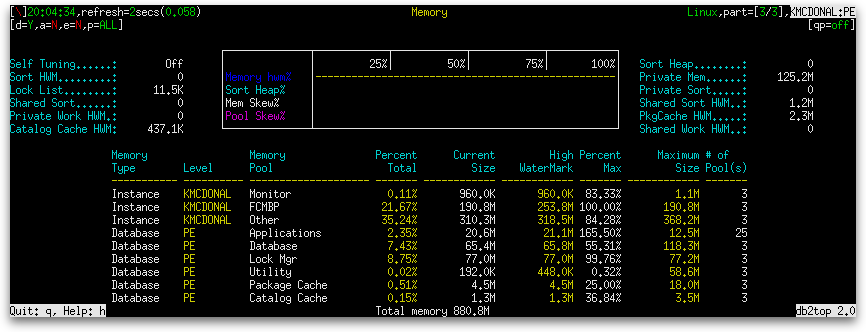
When the screen width is increased to 141 columns or wider, a column of names and values appears to the left of the set of gauges and another column of names and values appears to the right, as shown below:

In an upcoming post, we will examine each of these aggregates.


Pingback: Do db2top High Watermarks Give Wrong Answers? « The K Guy()