The db2top tool is very configurable. It would be inconvenient to configure it to your liking only to lose your configuration when you shut down the tool, so an option is available for saving your configuration to a file. Today we will examine this configuration file and look at what kinds of tweaks you can make, including:
- setting persistent command line arguments
- reducing disk consumption
- changing how columns are sorted
- changing the order in which columns are shown
- adding new actions to take when keys are pressed
- customizing the header
Saving your Configuration
The file to which your configuration is saved is named .db2toprc. The next time you start db2top, it reads from this file and sets your configuration back to the way it was the last time you updated .db2toprc. For db2top to know where to read your .db2toprc file, it first consults the $DB2TOPRC environment variable, then it looks for the file in your current working directory, and finally, it looks for the file in your $HOME directory.
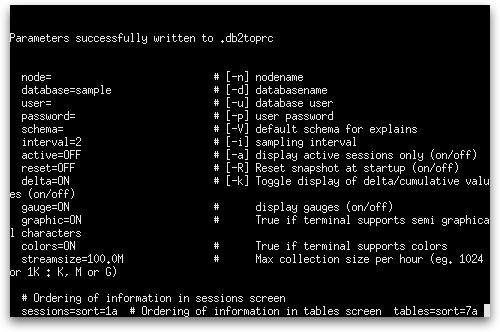
You save your configuration to .db2toprc by typing ‘w’ from any screen in the interactive tool. When you do, the file is written to your $HOME directory and a screen like the following is shown, illustrating the contents of the file (truncated because of the small screen height of 24 rows):
Persisting Command Line Arguments
The .db2toprc file is a text file that can be edited directly. Let’s look at its contents:
node= # [-n] nodename
database=pe # [-d] databasename
user= # [-u] database user
password= # [-p] user password (crypted)
schema= # [-V] default schema for explains
interval=5 # [-i] sampling interval
active=OFF # [-a] display active sessions only (on/off)
reset=OFF # [-R] Reset snapshot at startup (on/off)
delta=ON # [-k] Toggle display of delta/cumulative values (on/off)
These first nine rows, as indicated by the comments following the ‘#’ symbol, each correspond to a command line option that has been described in previous posts. One interesting line is the password line, which displays an encrypted password rather than the clear text.
Terminal Specific Options
graphic=ON # True if terminal supports semi graphical characters
colors=ON # True if terminal supports colors
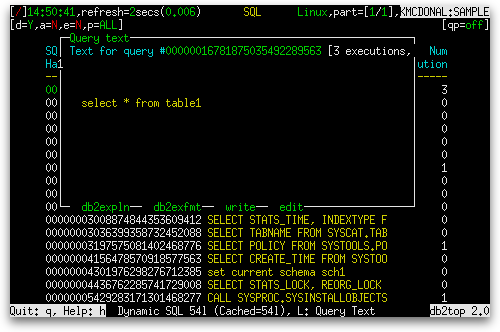
These next two columns are not available as command line options. If you were to modify the graphic value to OFF, popup windows would be rendered using non-graphic characters such as ‘|’, ‘-‘, and ‘+’. For example, when graphic is ON, the popup window on the Dynamic SQL screen looks like this:
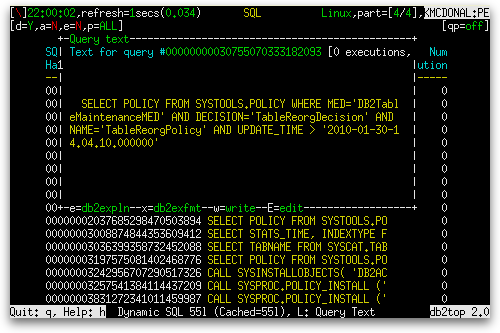
When graphic is OFF, the same window looks like this:
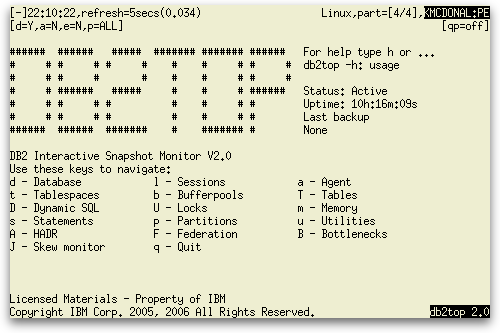
If you were to modify the colors value to OFF, db2top would rendered entirely in monochrome. For example, the home screen would look something like this:
Reducing Disk Consumption
The next two entries, also without command line equivalents, are port and streamsize:
port=8810 # Port for network collection
streamsize=100.0M # Max collection size per hour (eg. 1024 or 1K : K, M or G)
The port setting currently does nothing without putting db2top into an experimental mode, which I am not going to cover here. The streamsize setting lets you control how much data can be collected per hour when db2top is run in collector mode (such as when starting db2top with the -C command line option). If you were to set streamsize to a smaller value, say 1 megabyte, when you run db2top in collector mode, you get a message like the following:
db2top -d pe -C -m 1
[23:39:09] Starting DB2 snapshot data collector, collection every 5 second(s), max duration 1 minute(s), max file growth/hour 1.0M, hit to cancel...
[23:39:09] Overridding previous occurence of 'db2snap-pe-Linux64.bin'
[23:39:09] Increasing snapshot interval from 5 to 8 to limit volume of collection
[23:40:14] Max duration reached, 112.2K bytes, time was 64.720...
[23:40:14] Snapshot data collection stored in 'db2snap-pe-Linux64.bin'
Exiting...
When db2top saw that the streamsize was set to 1M, it increased the size of the snapshot interval to 8 to limit the amount of data collected per hour.
Sorting
The next nine lines let you change which column to sort by for nine of the screens (sessions, tables, tablespaces, bufferpools, dynamic SQL, statements, locks, utilities, and federation). Here is the first one, sessions:
# Ordering of information in sessions screen
sessions=sort=1a
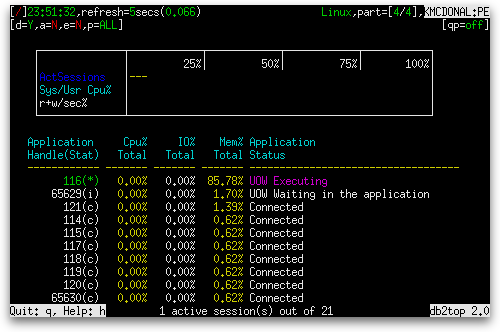
Here we sessions are sorted by column 1 in ascending order. Columns are counted starting at zero, so column 1 is the second column ‘Cpu% Total’. Let’s change this to sort by the fourth column ‘Mem% Total’ in descending order:
sessions=sort=3d
This has the following result:
Reordering Columns
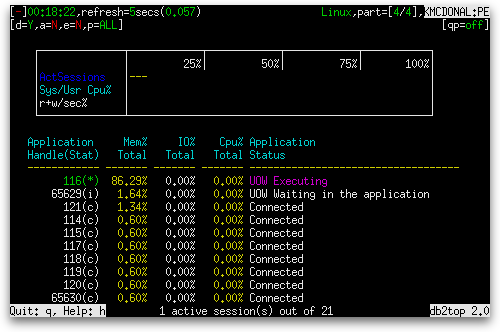
You can also change the order of the columns by listing the columns, separated by commas, in your new order after the first equals sign, as in:
sessions=3,2,1,sort=3d
This results in the columns Mem% Total and Cpu% Total swapping positions. Note that by saying sort=3d we still sort by Mem% Total since sort uses the column’s original position. The result is shown below:
Extending db2top with Functions
That takes us to the end of the .db2toprc file, but in the DB2 9.7 Information Center documentation on db2top, we can see that there are a few more entries one can make in the .db2toprc file. The first is a ‘function’ entry, such as the one below that runs date and netstat:
function N=date && netstat -t tcp
This line assigns to the key ‘N’ the two commands date and netstat together. When you press this key while interacting with db2top, you are taken to a screen like the following:
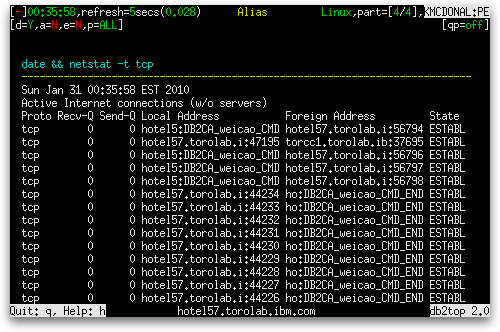
This is useful for commands that can have their output placed inside db2top. Other commands, such as the UNIX top command, cannot have their output run inside db2top. For such commands, you can use the keyword shell in place of function, as follows:
shell N=top
Pressing the ‘N’ key within db2top now causes db2top to spawn a shell to run db2top interactively on the console.
Customizing the Header
The final two options are for showing disk and cpu usage from the operating system in the header of db2top. The output is shown in the second line of the header on the right side of the screen. If you choose to set a value for both, Disk is shown first, followed by Cpu, followed by the usual [qp=off/on] indication. For example, the documentation for .db2toprc uses vmstat to get the information and awk to extract and combine just the numbers we need:
cpu=vmstat 2 2 | tail -1 | awk '{printf("%d(usr+sys)0,$14+$15);}'
io=vmstat 2 2 | tail -1 | awk '{printf("%d(bi+bo)",$10+$11);}'
This results in a header like the following after an initial delay of a few seconds:

