The final two command line options, -C and -f, work together. The -C option tells db2top to run in data collector mode and -f lets you tell db2top where to write or read the results of such a collection.
In data collector mode, db2top will write its output to a file or a pipe. When -C is specified without any arguments and without specifying the -f option along with it, a prompt like the following is presented:
[22:56:08] Starting DB2 snapshot data collector, collection every 2 second(s), max duration unlimited, max file growth/hour 100.0M, hit <CTRL+C> to cancel...

[22:56:08] Writing to 'db2snap-pe-Linux64.bin', should I create a named pipe instead of a file [N/y]?
In the above case, the database specified to db2top was “pe” and the platform was 64-bit Linux, so the file name/named pipe name it generated included these two facts. The prompt also reported that the max duration was unlimited. This default behavior can be overridden with the optional -m option. Use of the -m option when -C or -b is not also specified results in the following message:
*************************************************************************
*** ***
*** Error: Max duration is only valid in collection (-C) or background(-d) mode ***
*** ***
*************************************************************************
When prompted with the message asking whether to create a named pipe instead of a file, if you answer “N”, db2top will begin writing to the file. With a 5 minute duration specified with -m 5, you get output like the following:
db2top -d pe -C -m 5
[23:17:55] Starting DB2 snapshot data collector, collection every 2 second(s), max duration 5 minute(s), max file growth/hour 100.0M, hit <CTRL+C> to cancel...
[23:17:55] Writing to 'db2snap-pe-Linux64.bin', should I create a named pipe instead of a file [N/y]? N
[23:18:07] Creating 'db2snap-pe-Linux64.bin' as a normal file
[23:18:47] 1.0M written, time 52.516, 74.2M/hour
[23:19:29] 2.2M written, time 94.201, 85.5M/hour
[23:20:13] 3.4M written, time 138.070, 90.8M/hour
[23:21:01] 4.8M written, time 186.270, 93.3M/hour
[23:21:57] 6.3M written, time 242.755, 94.3M/hour
[23:22:54] 7.9M written, time 299.124, 95.8M/hour
[23:22:56] Max duration reached, 7.9M bytes, time was 301.204...
[23:22:56] Snapshot data collection stored in 'db2snap-pe-Linux64.bin'
Exiting...
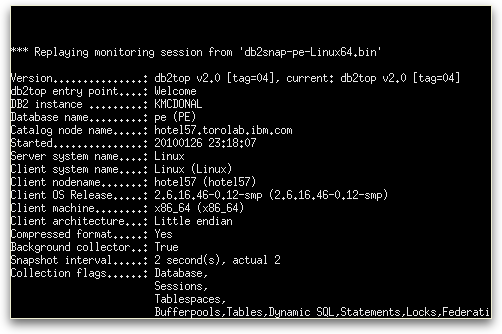
The generated file can now be replayed using the -f option. The first screen shown when you specify the -f option should look something like the following:

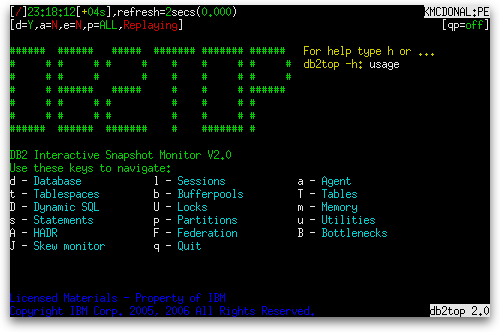
Pressing the Enter key while on this screen takes you to the usual db2top home screen with a few exceptions:
- The time shown in the top left of the screen is not the current time, but the time at which the collection was made.
- The time is followed by an offset in brackets that indicates how much later than the time at which collection started the snapshot you are looking at was taken. If, for example, collection started at 12:00:00 and the snapshot was taken 4 seconds later, you would see 12:00:00[+04s].
- There is an additional status indicator following the “p=” status indicator at the top left of the screen and it indicates that db2top is replaying a previously recorded set of snapshots.
- The platform and partition information normally shown in the top right of the screen is not shown.
- The status information that normally appears on right side of the home screen, such as uptime and last backup, is not shown.

The replay doesn’t start moving forward in time until you choose to leave the home screen and go to one of the other screens such as the sessions screen. Once you do, it will move forward in real time. That is, if you collected every two seconds when you ran the collection, the screen will update every two seconds and the offset shown at the top left of the screen will increase by two seconds with each update. Once the amount of time the collector ran originally (above we had it run for 5 minutes) has passed, the db2top interactive tool terminates and logs a message like the following to the console:
*** End of input stream reached, size was 7.9M...

Exiting...
You can also skip ahead by a certain amount of time by passing an argument to the -f option. The argument takes the form of a ‘+’ followed by the number of hours, minutes, or seconds to skip. Hours are indicated with an ‘h’, minutes with an ‘m’, and seconds with an ‘s’. For example, to skip 40 seconds into the data we just collected, you would specify:
db2top -d pe -f db2snap-pe-Linux64.bin +40s
If you were to skip to the end of the data collected, you would get a message like the following:
*** End of input stream reached, bytes skipped 169.8K (173,891), collection spanned 59s (59.000000 seconds), # of snapshots 30...

Exiting...
An alternative to skipping ahead by an amount of time is to specify the exact time you want to skip to by specifying a ‘/’ followed by the hours, minutes, and seconds separated by colons, as in the following example:
db2top -d pe -f db2snap-pe-Linux64.bin /11:38:50
If you attempt to specify both an offset to skip ahead by and an exact point in time to skip to, the point in time is used and the offset is ignored. For example, the following still puts you at 11:38:50:
db2top -d pe -f db2snap-pe-Linux64.bin /11:38:50 +50s
The default behavior when collecting is to collect all snapshots, which allows you to jump between screens during replay and see all the data, but it also makes the amount of data collected very large. You can also optionally specify sub-option arguments to the -C option similar to those you can specify to the -b option:
- d – database
- l – sesssions
- t – tablespaces
- b – bufferpools
- T – tables
- D – dynamic SQL
- s – statements
- U – locks
- F – federation
The following -b sub-options are not supported for -C:
- u – utilities
- m – memory
As with the -b option, you can combine sub-options to collect more than one type of snapshot. If you specify an invalid sub-option, you get a message containing the command line help followed by the following error message:
*************************************************************************
*** ***
*** Error: -C requires a valid suboption, only dltbTDsUF are supported ***
*** ***
*************************************************************************
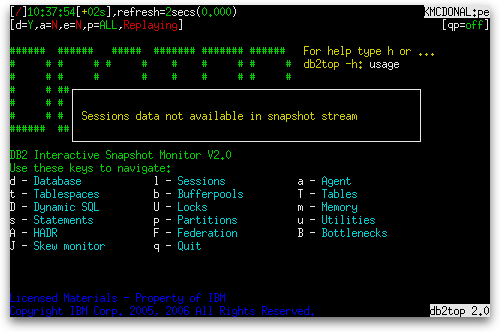
If you collect using a -C sub-option and run db2top in replay mode on the generated file, you will only be able go to those screens you collected data for. For example, if you specified that you wanted to collect only locks (-C U) and attempt to replay the sessions by pressing ‘l’ during the replay, you get the following message:

The automatic performance analysis option (-A) can also be used with replayed data. You collect as you normally would with the -C option, then when replaying with the -f option, you specify -A along with -b and a valid -b sub-option. For example, if you collect data from a database named “pe” to a file named collect.file, you would run an analysis of sessions as follows:
db2top -d pe -f collect.file -A -b l
That brings us to the end of the db2top command line options. In future posts, we will examine the various screens of information available in interactive mode and look at the various options available in the .db2toprc file.
