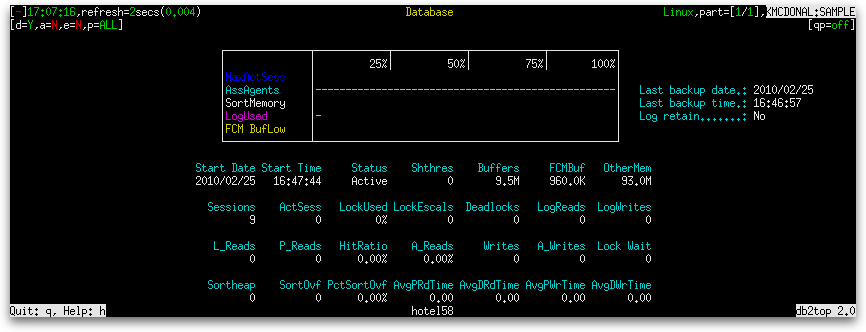
The first major screen of db2top that we will examine is the Database screen. This screen gives you the big picture view of your database. You can use this screen to see how busy your database is in terms of the number of applications connected to it and issuing work, the amounts of memory being consumed for various purposes, such as sorts or the caching of reads and writes, the efficiency of I/O, and the impacts of contention, such as high lock wait times and lock escalations.
The database screen differs from the majority of screens in db2top in that it only ever has one object to show – the database itself. It takes advantage of this by showing every column at once and not requiring you to scroll to see more. The top half of the screen consists of a set of four gauges when the screen is between 80 and 140 columns wide:
| Gauge Name | Gauge Type | Definition |
|---|---|---|
| MaxActSess | Normal | The current number of connections with executing work in proportion to the highest number of connections simultaneously executing work. (local_cons_in_exec + rem_cons_in_exec) / coord_agents_top |
SortMemory | Normal | The total sort memory (both shared and private) in proportion to the sort memory threshold configured for the database manager. (sort_heap_allocated + sort_shrheap_allocated) / sheapthres |
| LogUsed | Normal | The proportion of total log space that is consumed by uncommitted transactions. total_log_used / (total_log_available + total_log_used) |
| FCM BufLow | Normal | (buff_free – buff_free_bottom) / buff_free_bottom |
A fifth gauge, AssAgents, is added between MaxActSess and SortMemory when the screen is wider than 140 columns:
| Gauge Name | Gauge Type | Definition |
|---|---|---|
| AssAgents | Normal | The proportion of registered database agents that are not idle. 1 – (idle_agents / agents_registered) |

The second change that happens when the screen width is 141 columns or wider is that, if you have taken a backup of the database, you will see three rows of backup information to the right of the gauges, as shown below:

The three new rows are as follows:
- Last backup date
- Last backup time
- Log retain
The bottom half of the screen consists of four rows of seven columns each. Each column has a title with a corresponding value beneath it. In the next post, we will examine each of the four rows of data.

