db2top Bottlenecks Screen (Part 1)

Necks of three bottles

A database workload performs at its best when resources are made available to it in all the right proportions. Having any one resource constrained too much and everything slows down. You can have more CPU cycles available than you’ll ever need, but if your IO subsystem can’t keep up with the work, it becomes a bottleneck and you’ll never achieve your desired throughput. In today’s post, we’ll take a look at the db2top Bottlenecks screen and see how it can help you find and resolve bottlenecks in your system by finding the top consumers of each of the major system resources.

You can launch the Bottlenecks screen by holding the Shift key and pressing the ‘B’ key. This produces a screen like the following:
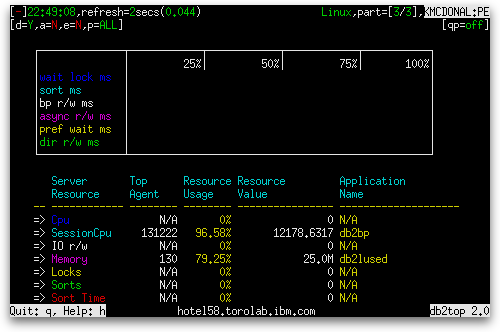
db2top Bottlenecks screen at 24 rows high

The screen is the usual combination of a set of gauges on top and a table beneath it. The gauges are as follows:

Gauge Name Gauge Type Definition
wait lock ms Normal Percentage of total time spent waiting for locks. 

lock_wait_time / (lock_wait_time + total_sort_time + pool_read_time + pool_write_time + pool_async_read_time + pool_async_write_time + prefetch_wait_time + direct_read_time + direct_write_time)

sort ms Normal Percentage of total time spent performing sorts.

total_sort_time / (lock_wait_time + total_sort_time + pool_read_time + pool_write_time + pool_async_read_time + pool_async_write_time + prefetch_wait_time + direct_read_time + direct_write_time)

bp r/w/ ms Normal Percentage of total time spent performing buffer pool I/O.

(pool_read_time + pool_write_time) / (lock_wait_time + total_sort_time + pool_read_time + pool_write_time + pool_async_read_time + pool_async_write_time + prefetch_wait_time + direct_read_time + direct_write_time)

async r/w ms Normal Percentage of total time spent performing asynchronous I/O.

(pool_async_read_time + pool_async_write_time) / (lock_wait_time + total_sort_time + pool_read_time + pool_write_time + pool_async_read_time + pool_async_write_time + prefetch_wait_time + direct_read_time + direct_write_time)

pref wait ms Normal Percentage of total time spent waiting for prefetches to occur.

prefetch_wait_time / (lock_wait_time + total_sort_time + pool_read_time + pool_write_time + pool_async_read_time + pool_async_write_time + prefetch_wait_time + direct_read_time + direct_write_time)

dir r/w ms Normal Percentage of total time spent performing direct I/O.

(direct_read_time + direct_write_time) / (lock_wait_time + total_sort_time + pool_read_time + pool_write_time + pool_async_read_time + pool_async_write_time + prefetch_wait_time + direct_read_time + direct_write_time)

The table consists of the following columns:

Column Name Definition
Server Resource

The name of the resource. The following are the resources reported in this table:

  • Cpu
  • SessionCpu
  • IO r/w
  • Memory
  • Locks
  • Sorts
  • Sort Time
  • Log Used
  • Overflows
  • RowsRead
  • RowsWritten
  • TQ r/w
  • MaxQueryCost
  • XDAPages
Top Agent The system-wide unique ID for the application that is the greatest consumer of this resource (agent_id).
Resource Usage Different for each resource. Described later.
Resource Value Different for each resource. Described later.
Application Name The name of the application running at the client, as known to the database, that is the greatest consumer of this resource (appl_name). “N/A” if resource usage is zero.

In the second post on the db2top Bottlenecks screen, I will cover each row reported in the table.

For other articles on db2top at this site, see the main db2top page.

  • PAul

    Hello Keith! I really like your posts, but I have no clear When a value (for the gauges) is good for the database and when it is bad?
    For this post it is clear (it is very obvious), but not for all other posts

    If you have time, please could you give examples in your posts?

    Regards,

  • Keith McDonald

    Hi,

    Thank you for commenting. I’ll take a look at my older articles and see if I can improve them where they are unclear. When this is done (it may take a few weeks because I want to finish up descriptions of the remaining features), I will create a new post linking to the updated articles. Regarding examples, I think I may start a new series in which I return to each screen to give examples of their use and maybe describe what actions to take when a gauge or other stat has a certain value, e.g. do a reorg when overflows are over a certain threshold.

    Keith

  • Debasis11

    Ya Keith…thanks a lot for the post…Can you please tell us what value is good and what value is bad for each parameters for a database  when you get some time…thanks